Diagnostic page
Open the Diagnostic page from the Debugging link at the bottom of About & Support (debug.html). It is not linked from the main sidebar, it's an advanced/support-oriented page, most useful when reporting a bug.
For everyday tab issues (broken favicons, Tab Groups after a restart), try Tab Health first, it has one-click fixes. Use the Diagnostic page when you need raw logs or lower-level state to attach to a bug report.
Controls
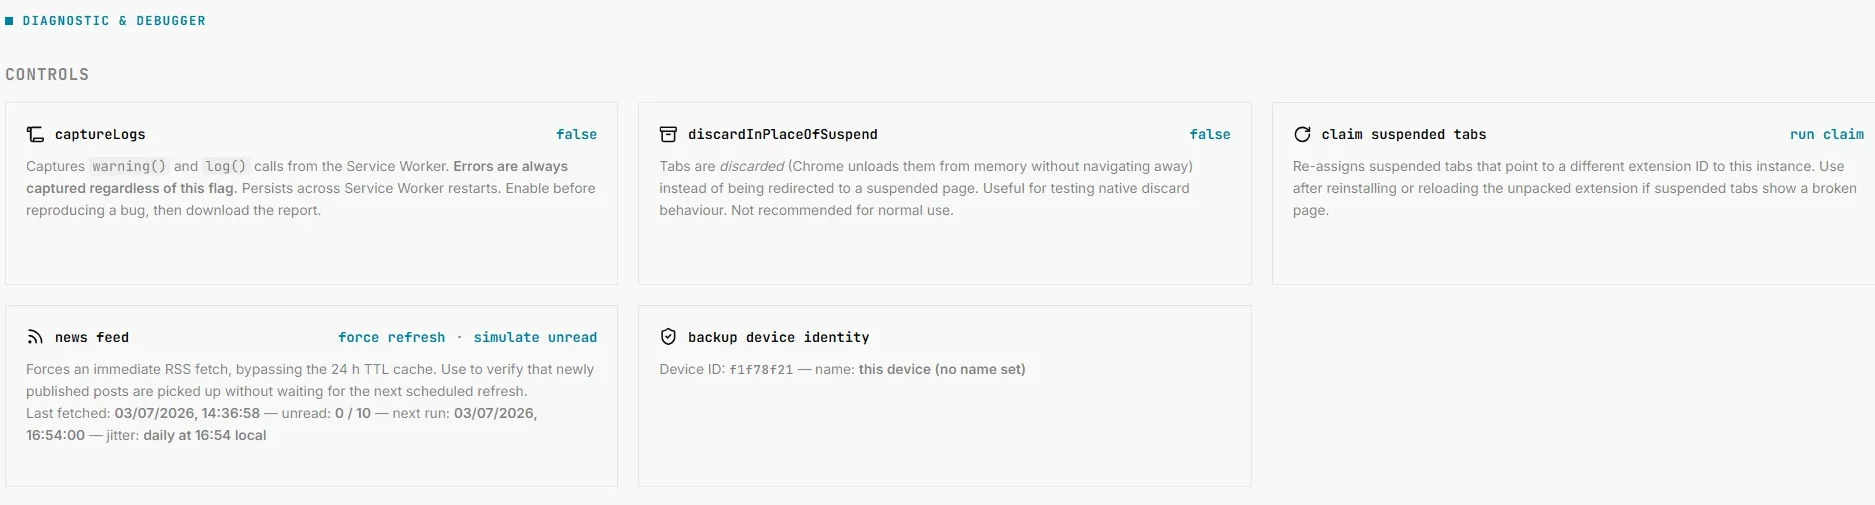
captureLogs
Off by default. When enabled, TMS also captures warning() and regular log() calls from the Service Worker into the persistent log buffer (errors are always captured regardless of this toggle). Turn this on before reproducing an intermittent bug, then use Download report once you've reproduced it. The flag persists across Service Worker restarts.
discardInPlaceOfSuspend
Off by default, and not recommended for normal use. When enabled, tabs are discarded by Chrome's native mechanism instead of being redirected to TMS's suspended page. Useful only for comparing TMS's behavior against native Chrome discarding while testing.
claim suspended tabs
Click run claim to re-assign any suspended tabs that currently point at a different extension ID back to this installation. Use this after reinstalling TMS or reloading it unpacked during development, if previously-suspended tabs show a broken page because their URL still references the old extension ID.
favicon cache
Repair action added in 9.0.2. clear cache wipes every cached favicon, rebuilt from Chrome's own cache the next time each tab is suspended. repair favicons now is more targeted: it re-checks currently open suspended tabs on demand without wiping the whole cache, useful right after a crash/session restore or on installs from before 9.0.2's startup-sentinel fallback.
changelog modal
Click reset "seen" flag to clear the "already shown" marker for the "What's new" modal, so opening Settings shows it again without needing to bump the manifest version, useful for re-testing it on an unpacked/dev install.
news feed
Shows the last fetch time, unread/total article count, next scheduled alarm, and this device's randomized daily refresh time slot for News. force refresh bypasses the 24-hour cache and fetches immediately, only visible on unpacked/developer builds, not on the Chrome Web Store release.
power source
Added in 9.0.3. Shows whether TMS currently sees the device as running on AC power or on battery, live-updating on a charge-state change, the same signal driving the battery-aware timeout and the "never suspend while charging" option. Useful for confirming what the extension actually detects without guessing from behavior alone.
backup device identity
Shows this browser installation's backup device ID and friendly name (see Backup & Sync), useful for identifying which device a given cloud backup file belongs to. The ID is shown in monospace and can be selected/copied in one click for support purposes.
Log buffer
A live, colour-coded (by severity) view of the persistent log buffer, up to 500 entries, surviving Service Worker restarts.

| Button | Effect |
|---|---|
| Refresh | Reloads the log view from storage |
| Clear log | Empties the buffer |
| Warnings & errors only | Added in 9.0.2. Toggles a filter that hides regular info-level entries, showing only warnings/errors |
| Copy report | Copies a bundled report (TMS version, browser user-agent, tab profiler snapshot, full log buffer) to the clipboard as plain text |
| Download report | Saves the same bundled report as a downloadable text file |
Each log entry shows its level, source, message and time. Since 9.0.3, the timestamp is date-prefixed for any entry that isn't from today, since the buffer rotates rather than clearing on its own and older entries routinely sit alongside today's.
Use Copy report or Download report when filing a GitHub issue, it gives maintainers a self-contained, shareable diagnostic without needing you to open DevTools yourself.
This report can include tab titles, URLs and other data from your open tabs. Don't paste it directly into a public GitHub issue, upload it to logdrop instead and share the link it gives you. Only the maintainer can read it, and the upload expires on its own.
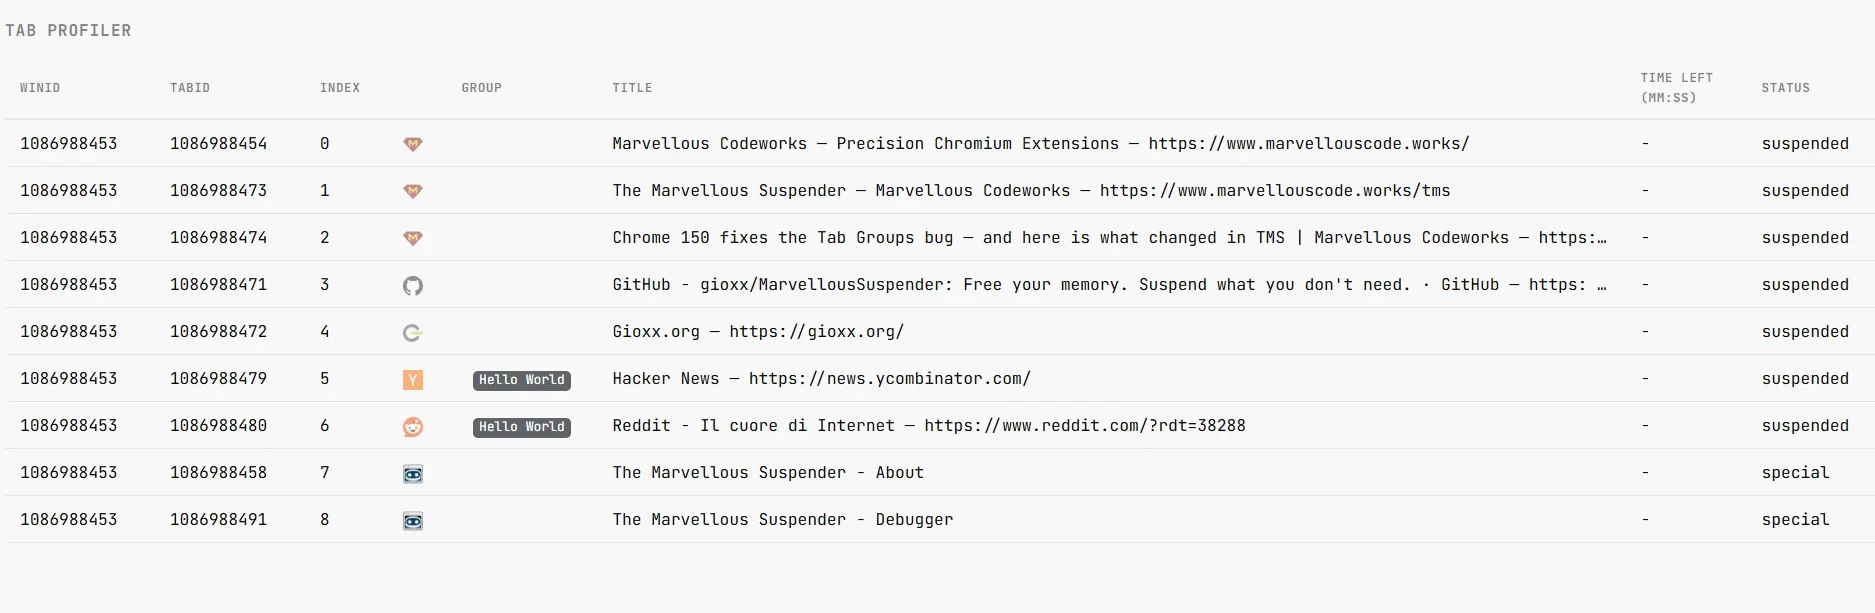
Tab profiler
A live table of every currently open tab TMS is tracking, refreshed continuously: window ID, tab ID, tab index, tab group, title, remaining time before auto-suspend (MM:SS), and current status. Useful for confirming why a specific tab isn't being suspended when you expect it to be, cross-reference the status column against Settings → Suspend and the popup's status descriptions.